Data Visualization - Ellucian - 2015-2016
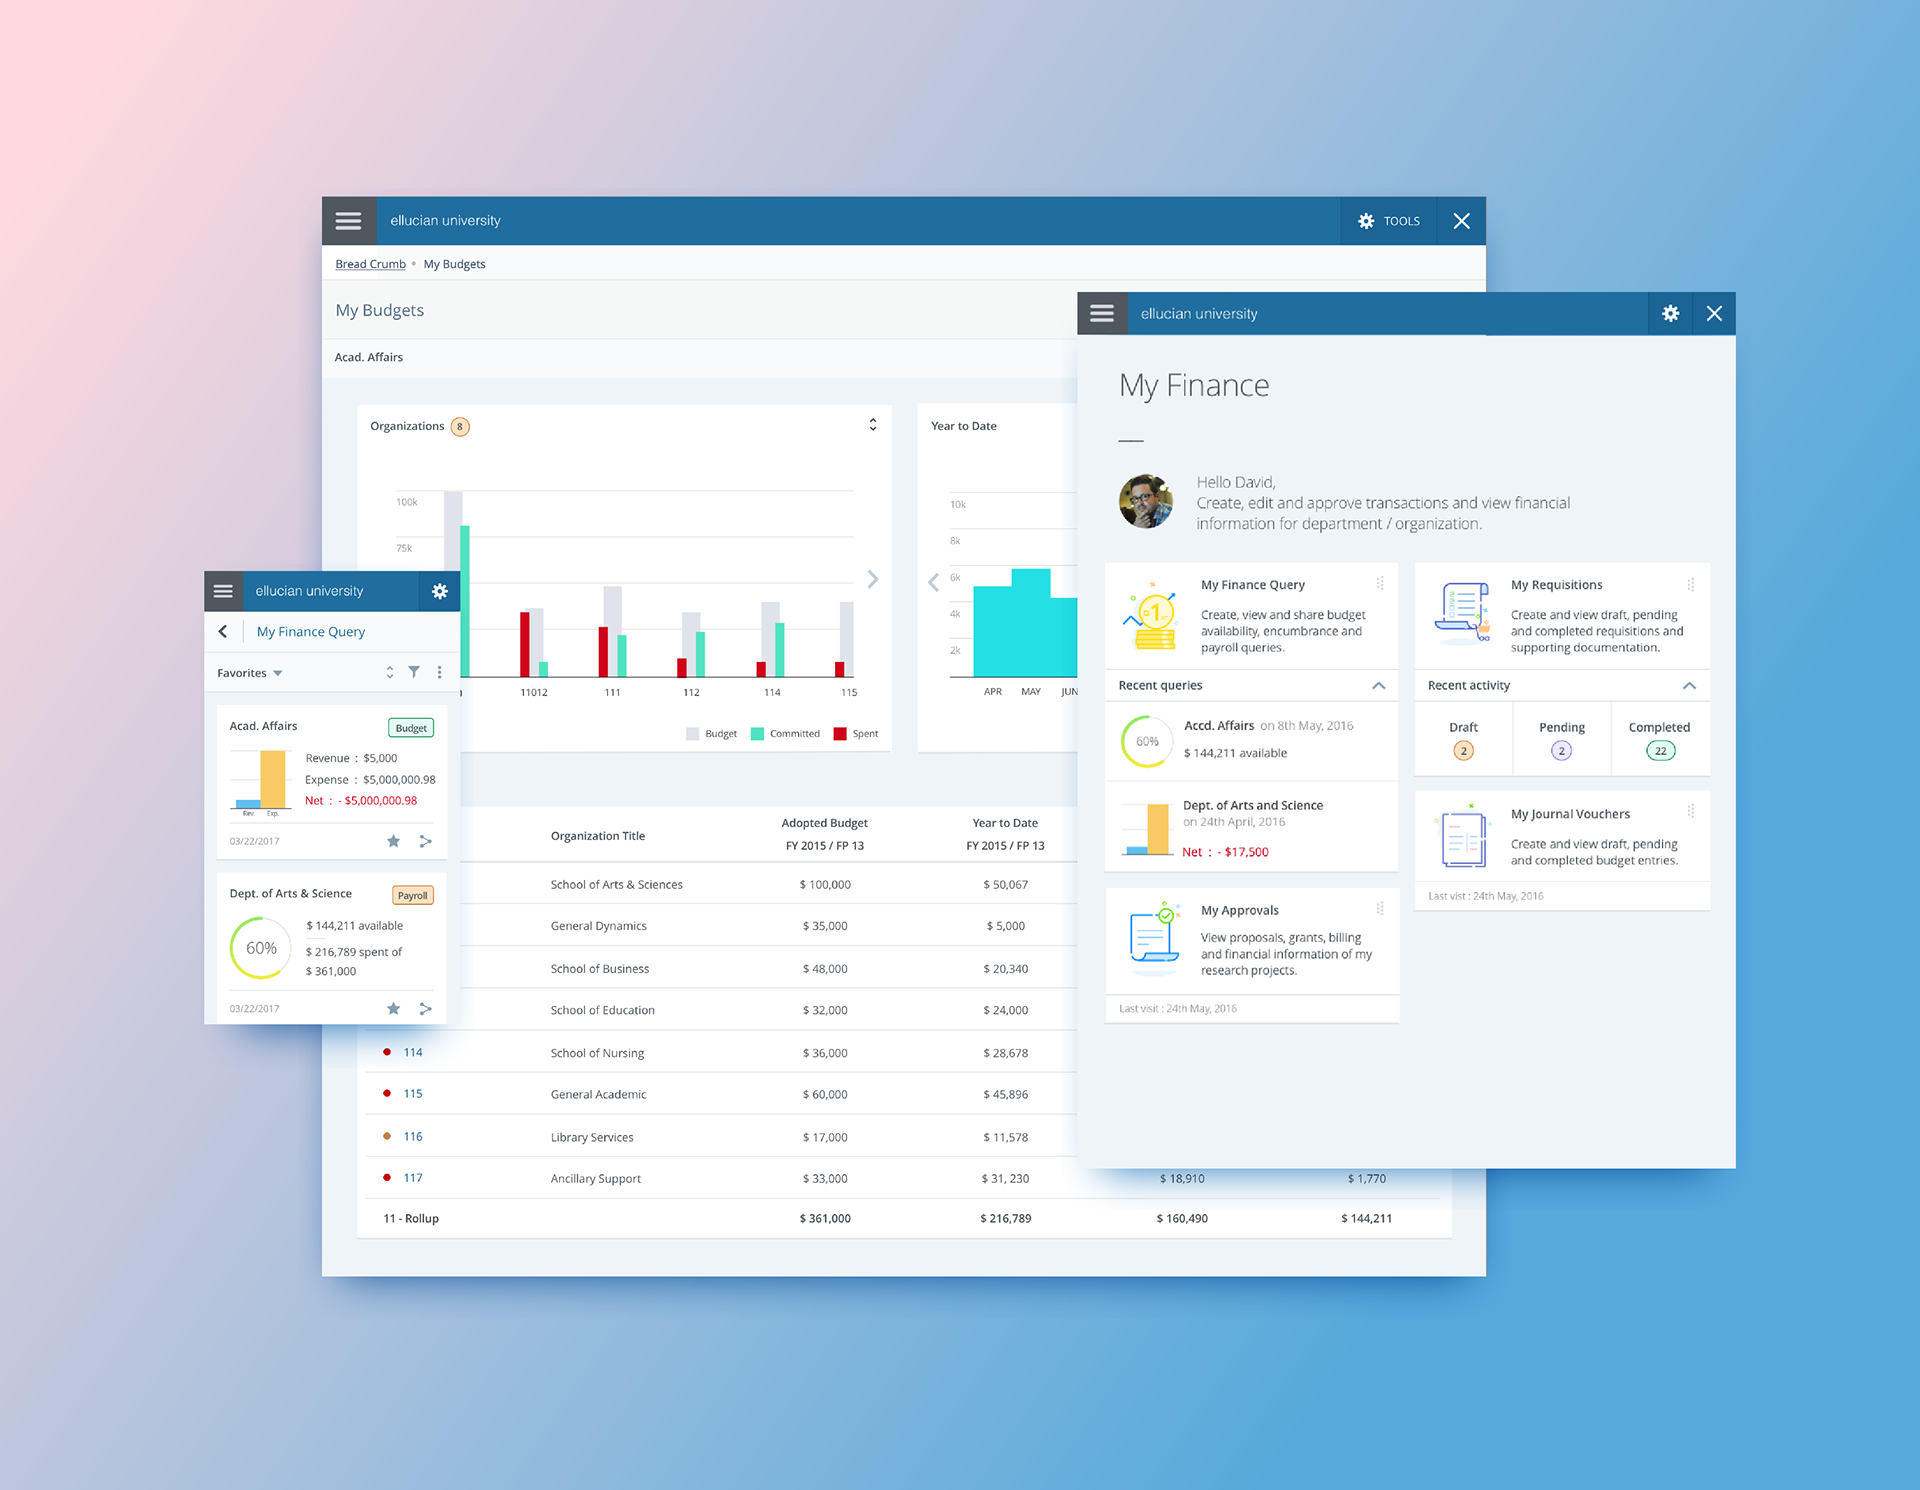
My Finance Query: budget visibility and drill-down finance UX.
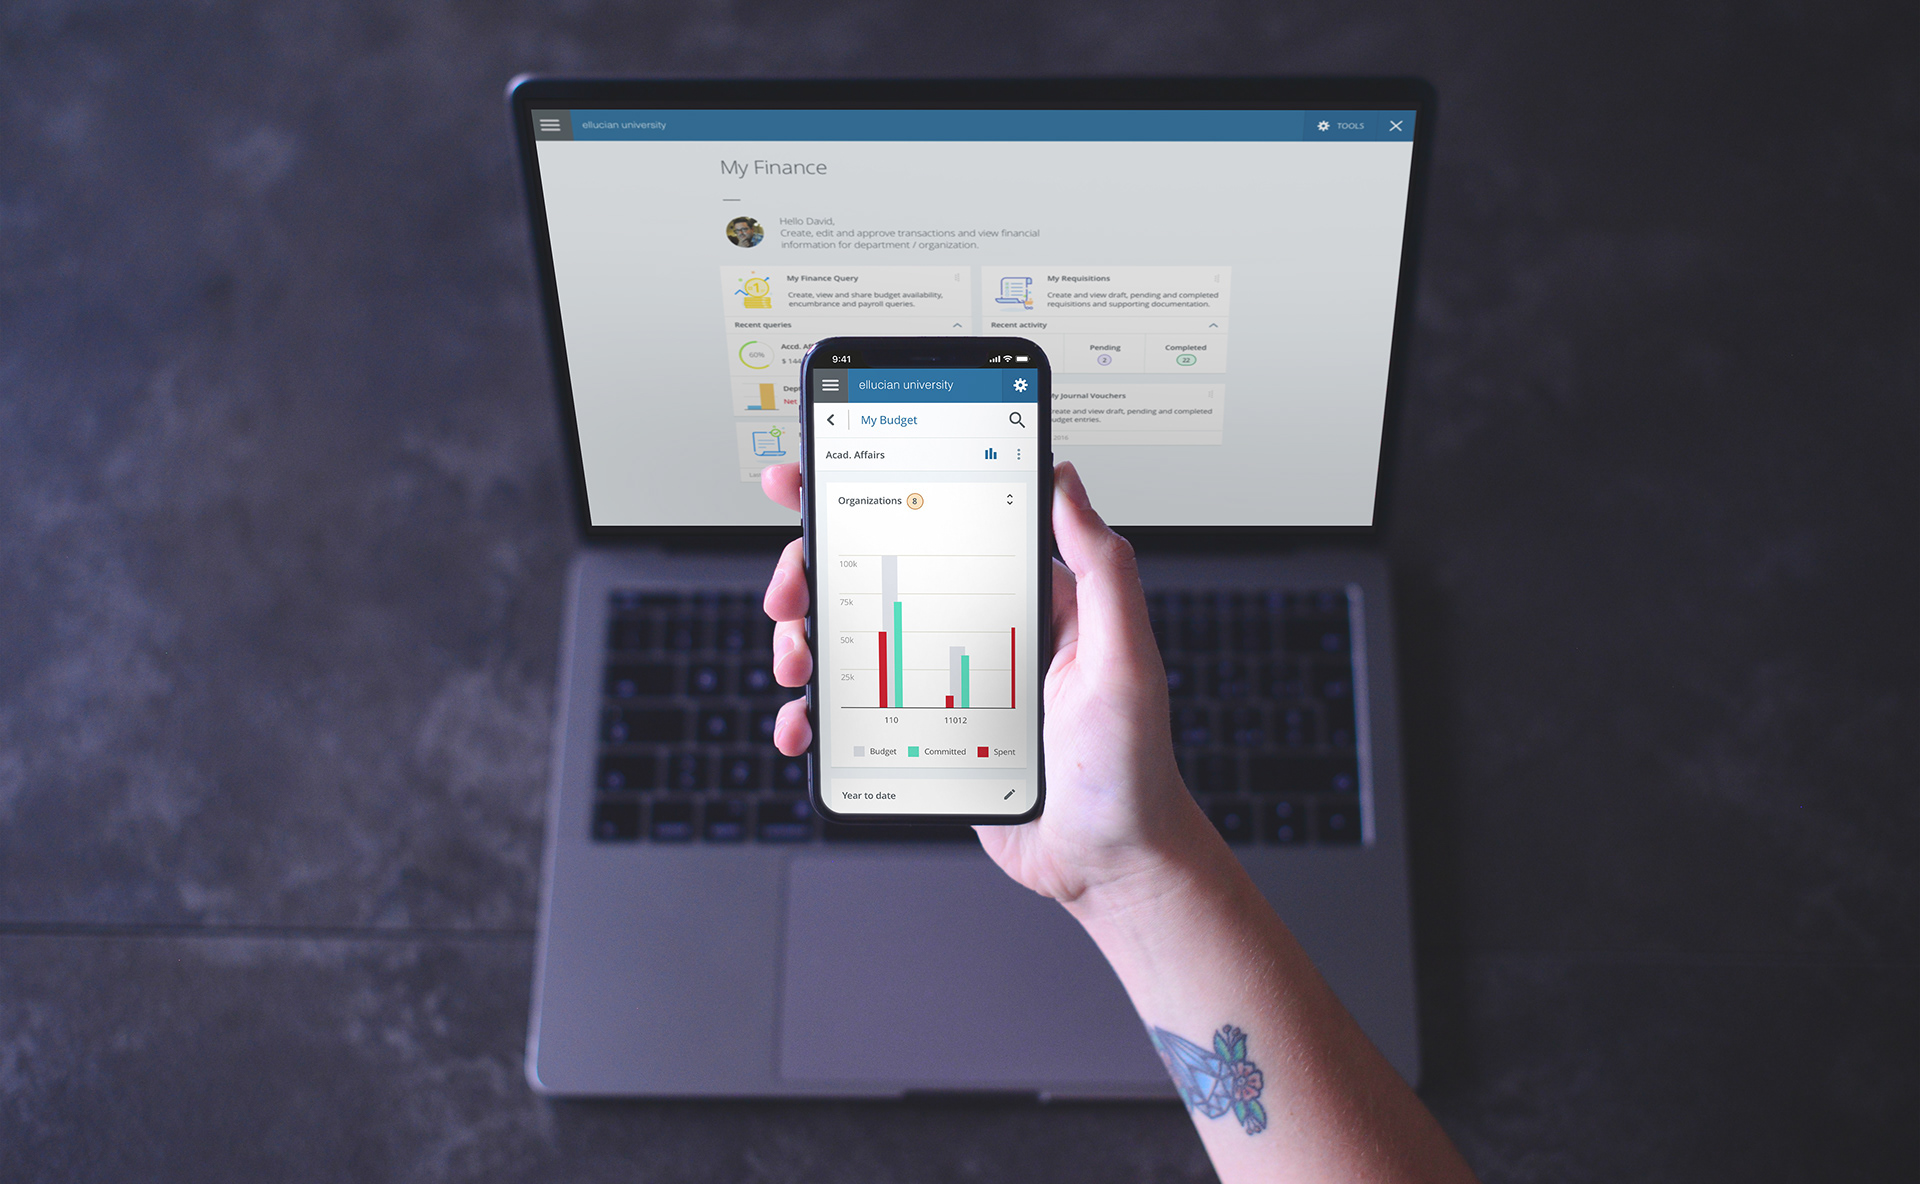
A higher education finance product experience for creating, viewing, and sharing budget availability, encumbrance, and payroll queries.
Challenge
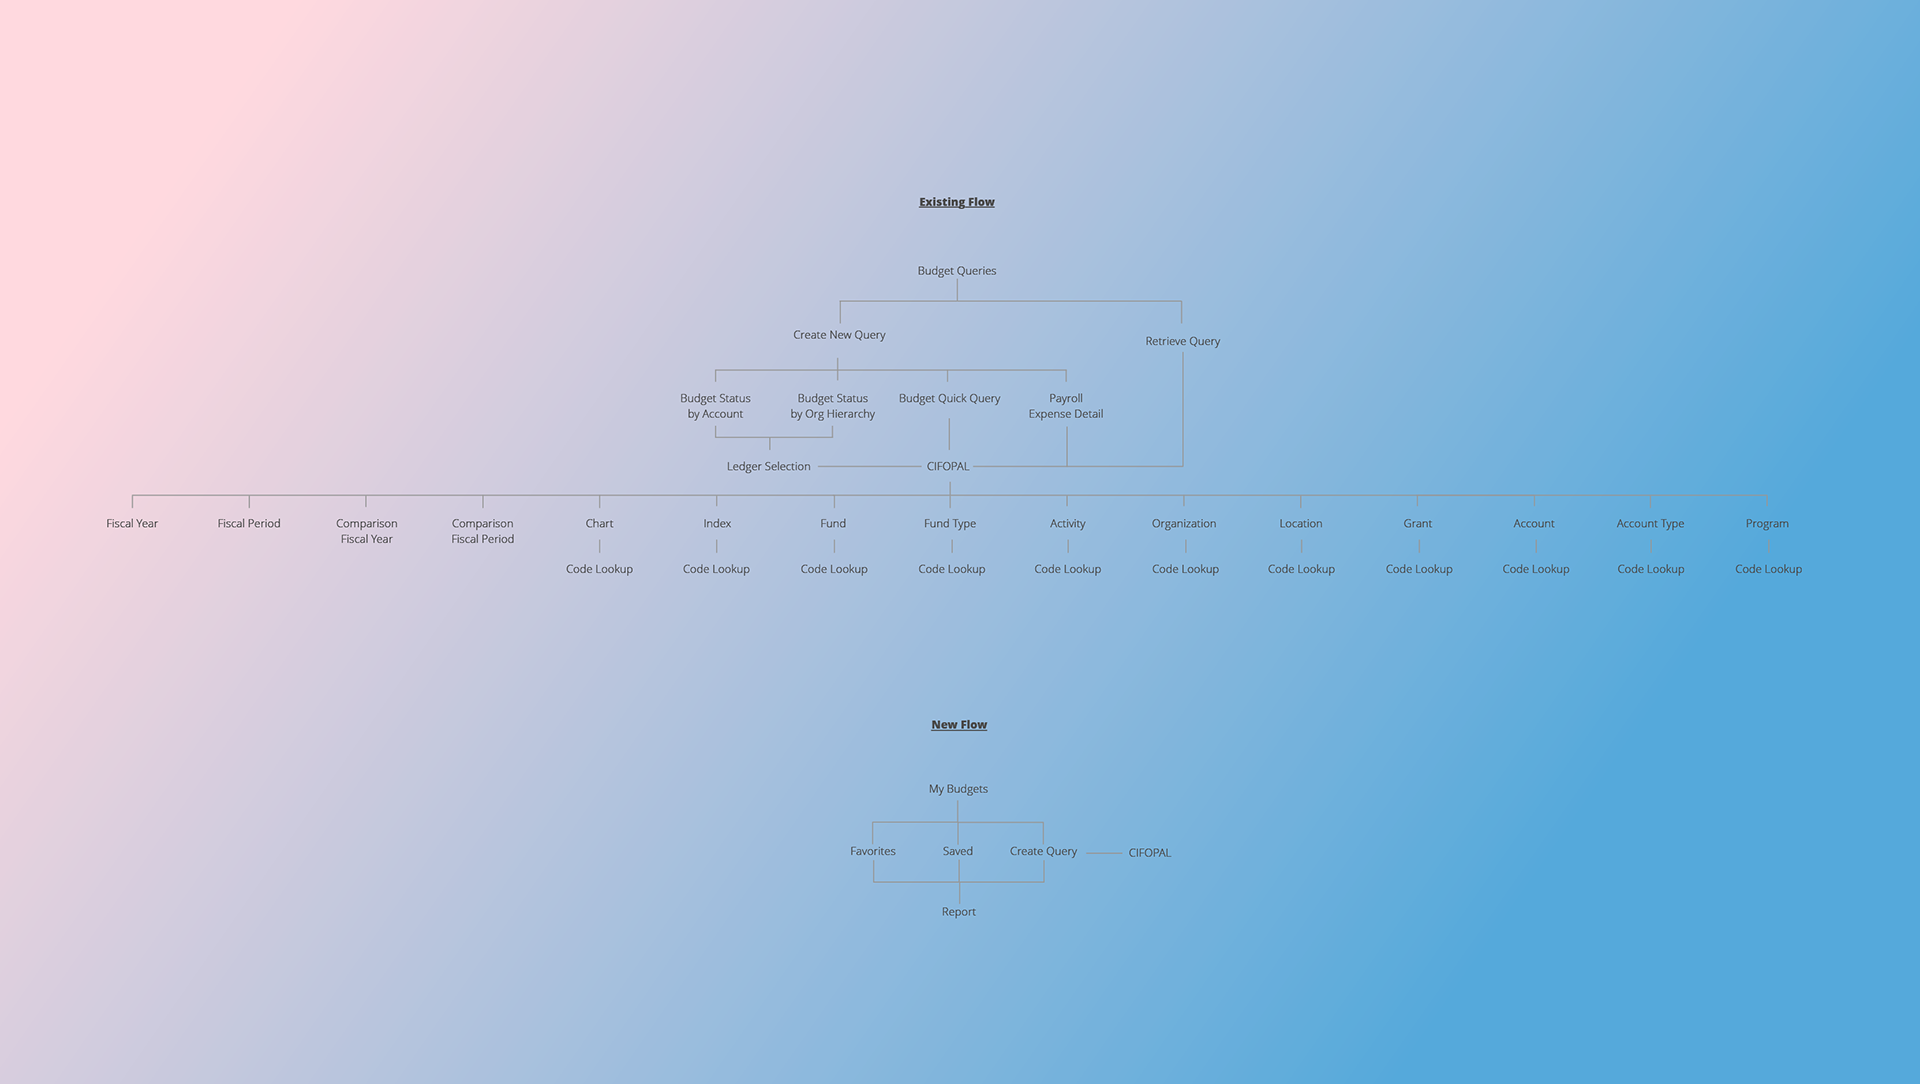
Finance users needed faster ways to understand remaining balances, compare financial data across time frames, and move from summary information to document-level details. The experience had to make complex finance data more readable and actionable.
What I did
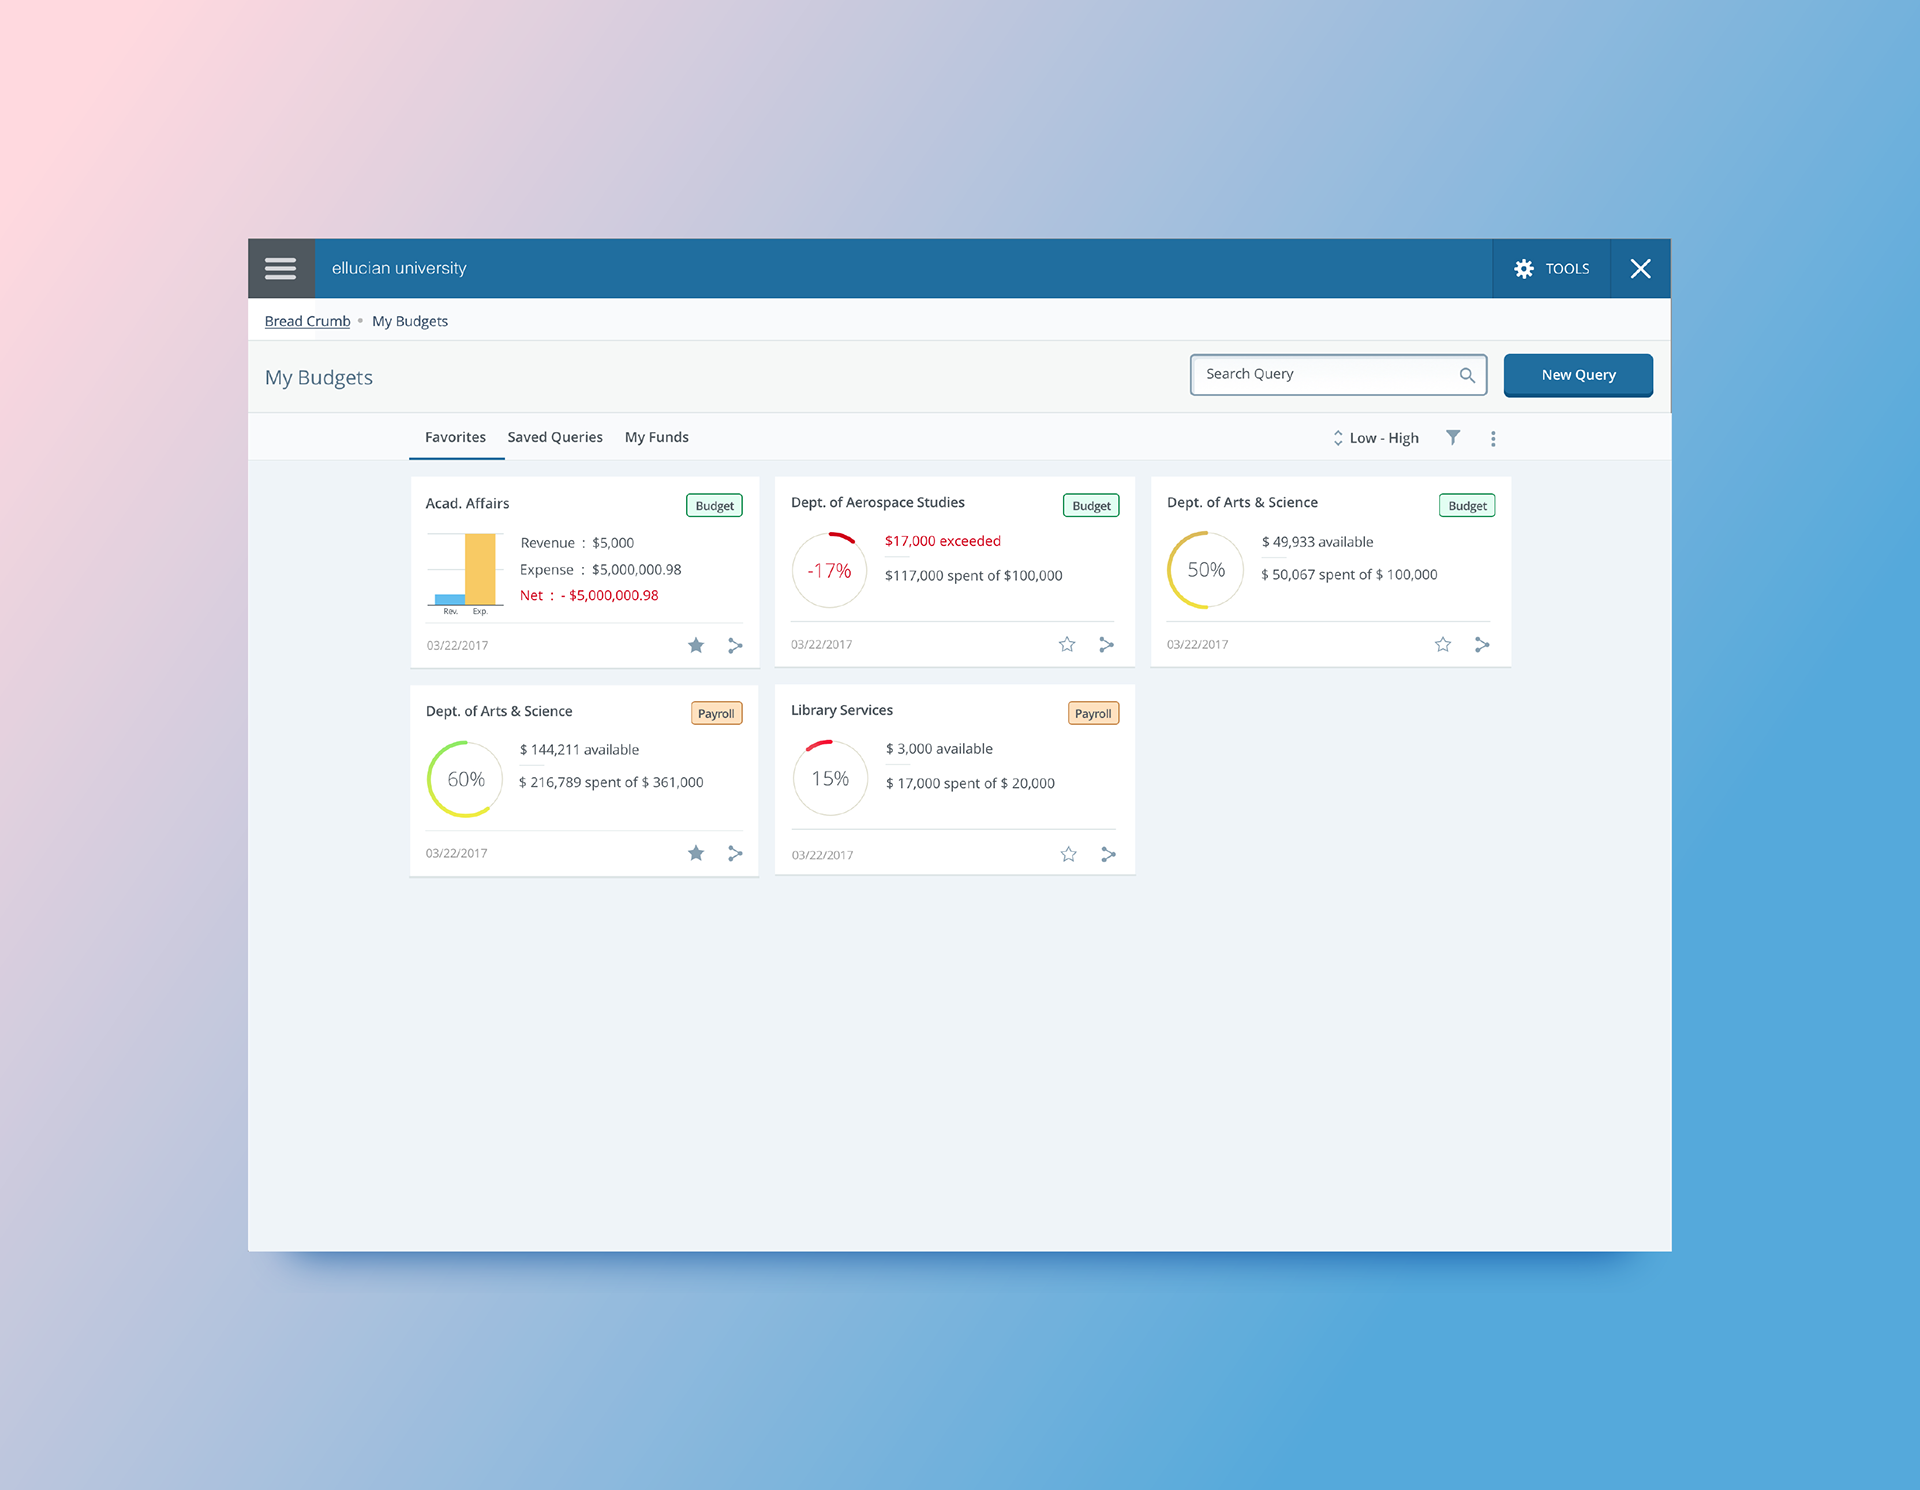
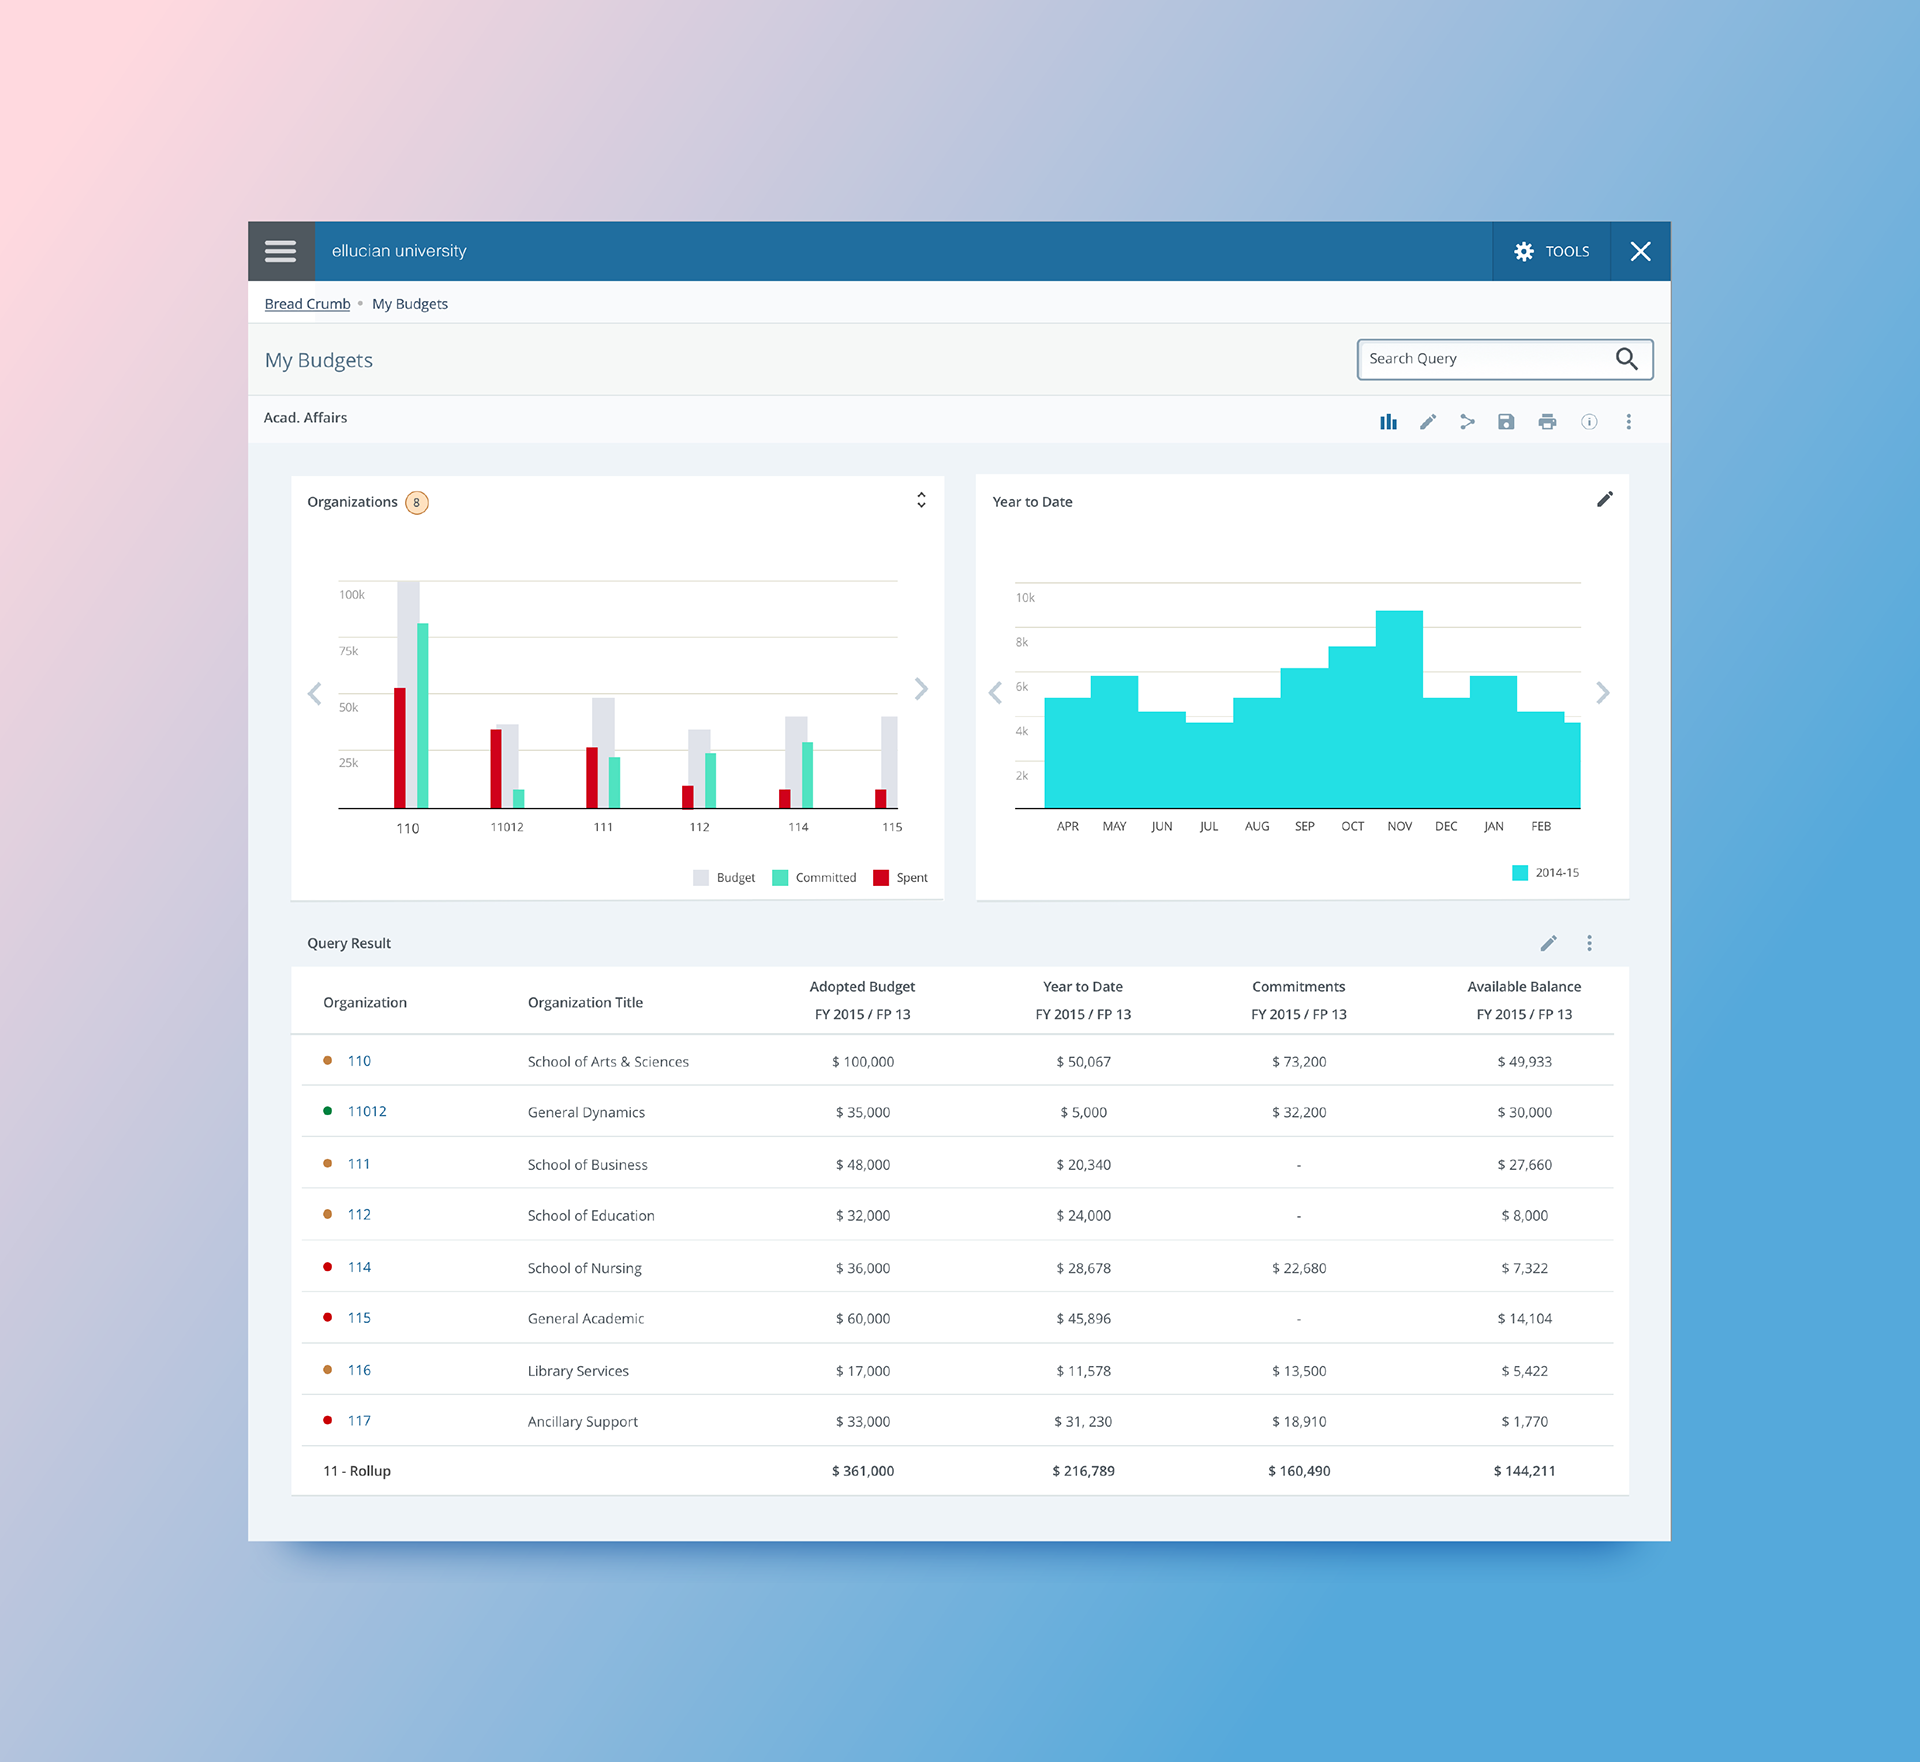
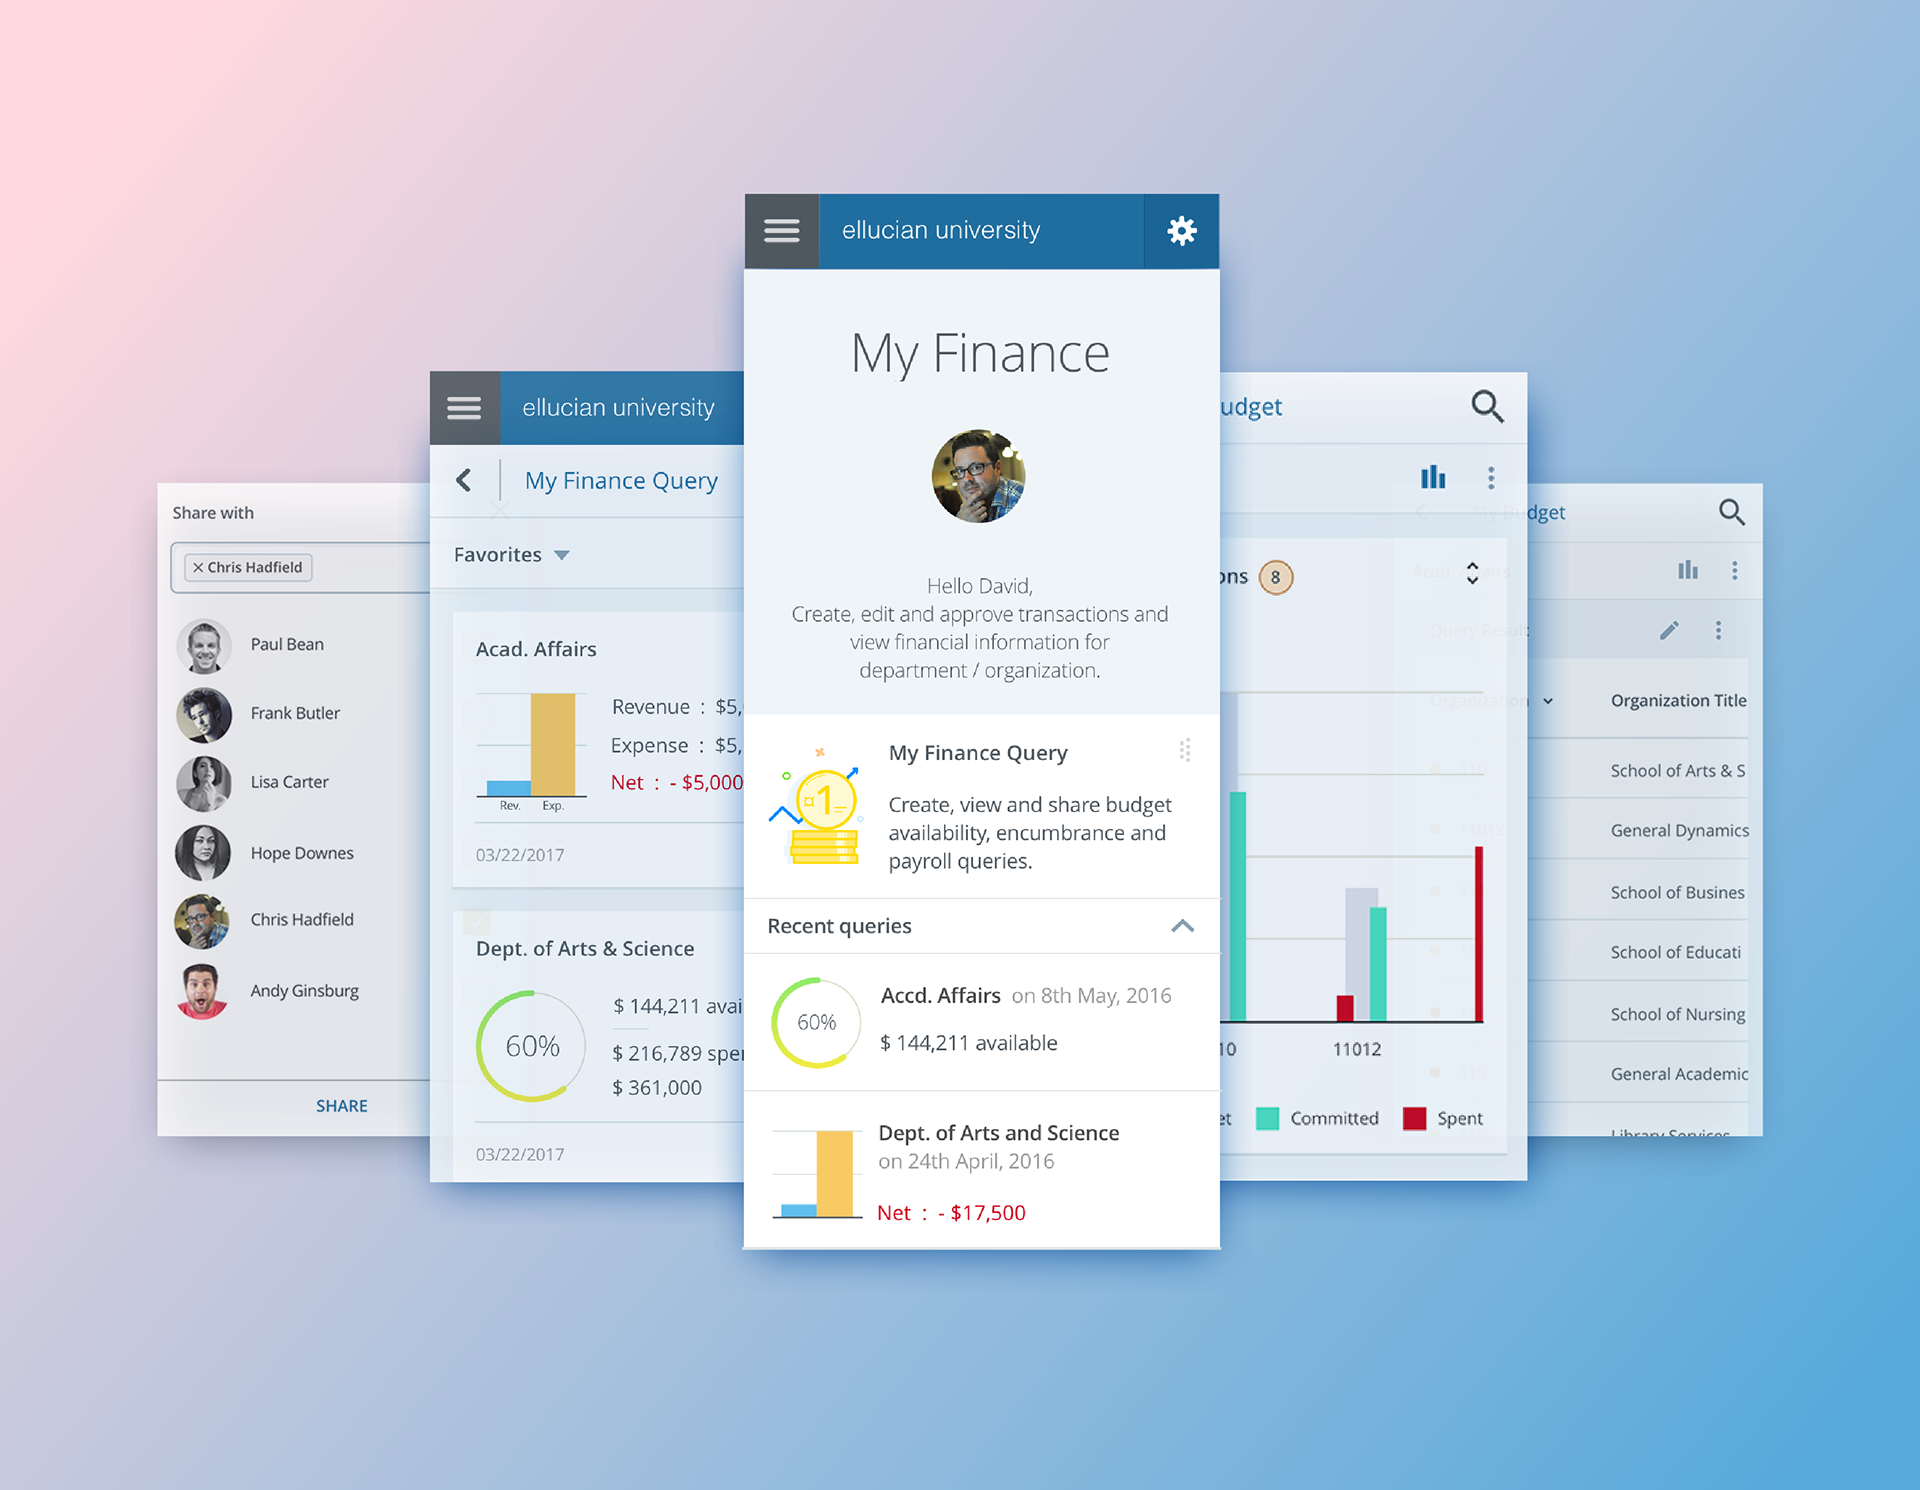
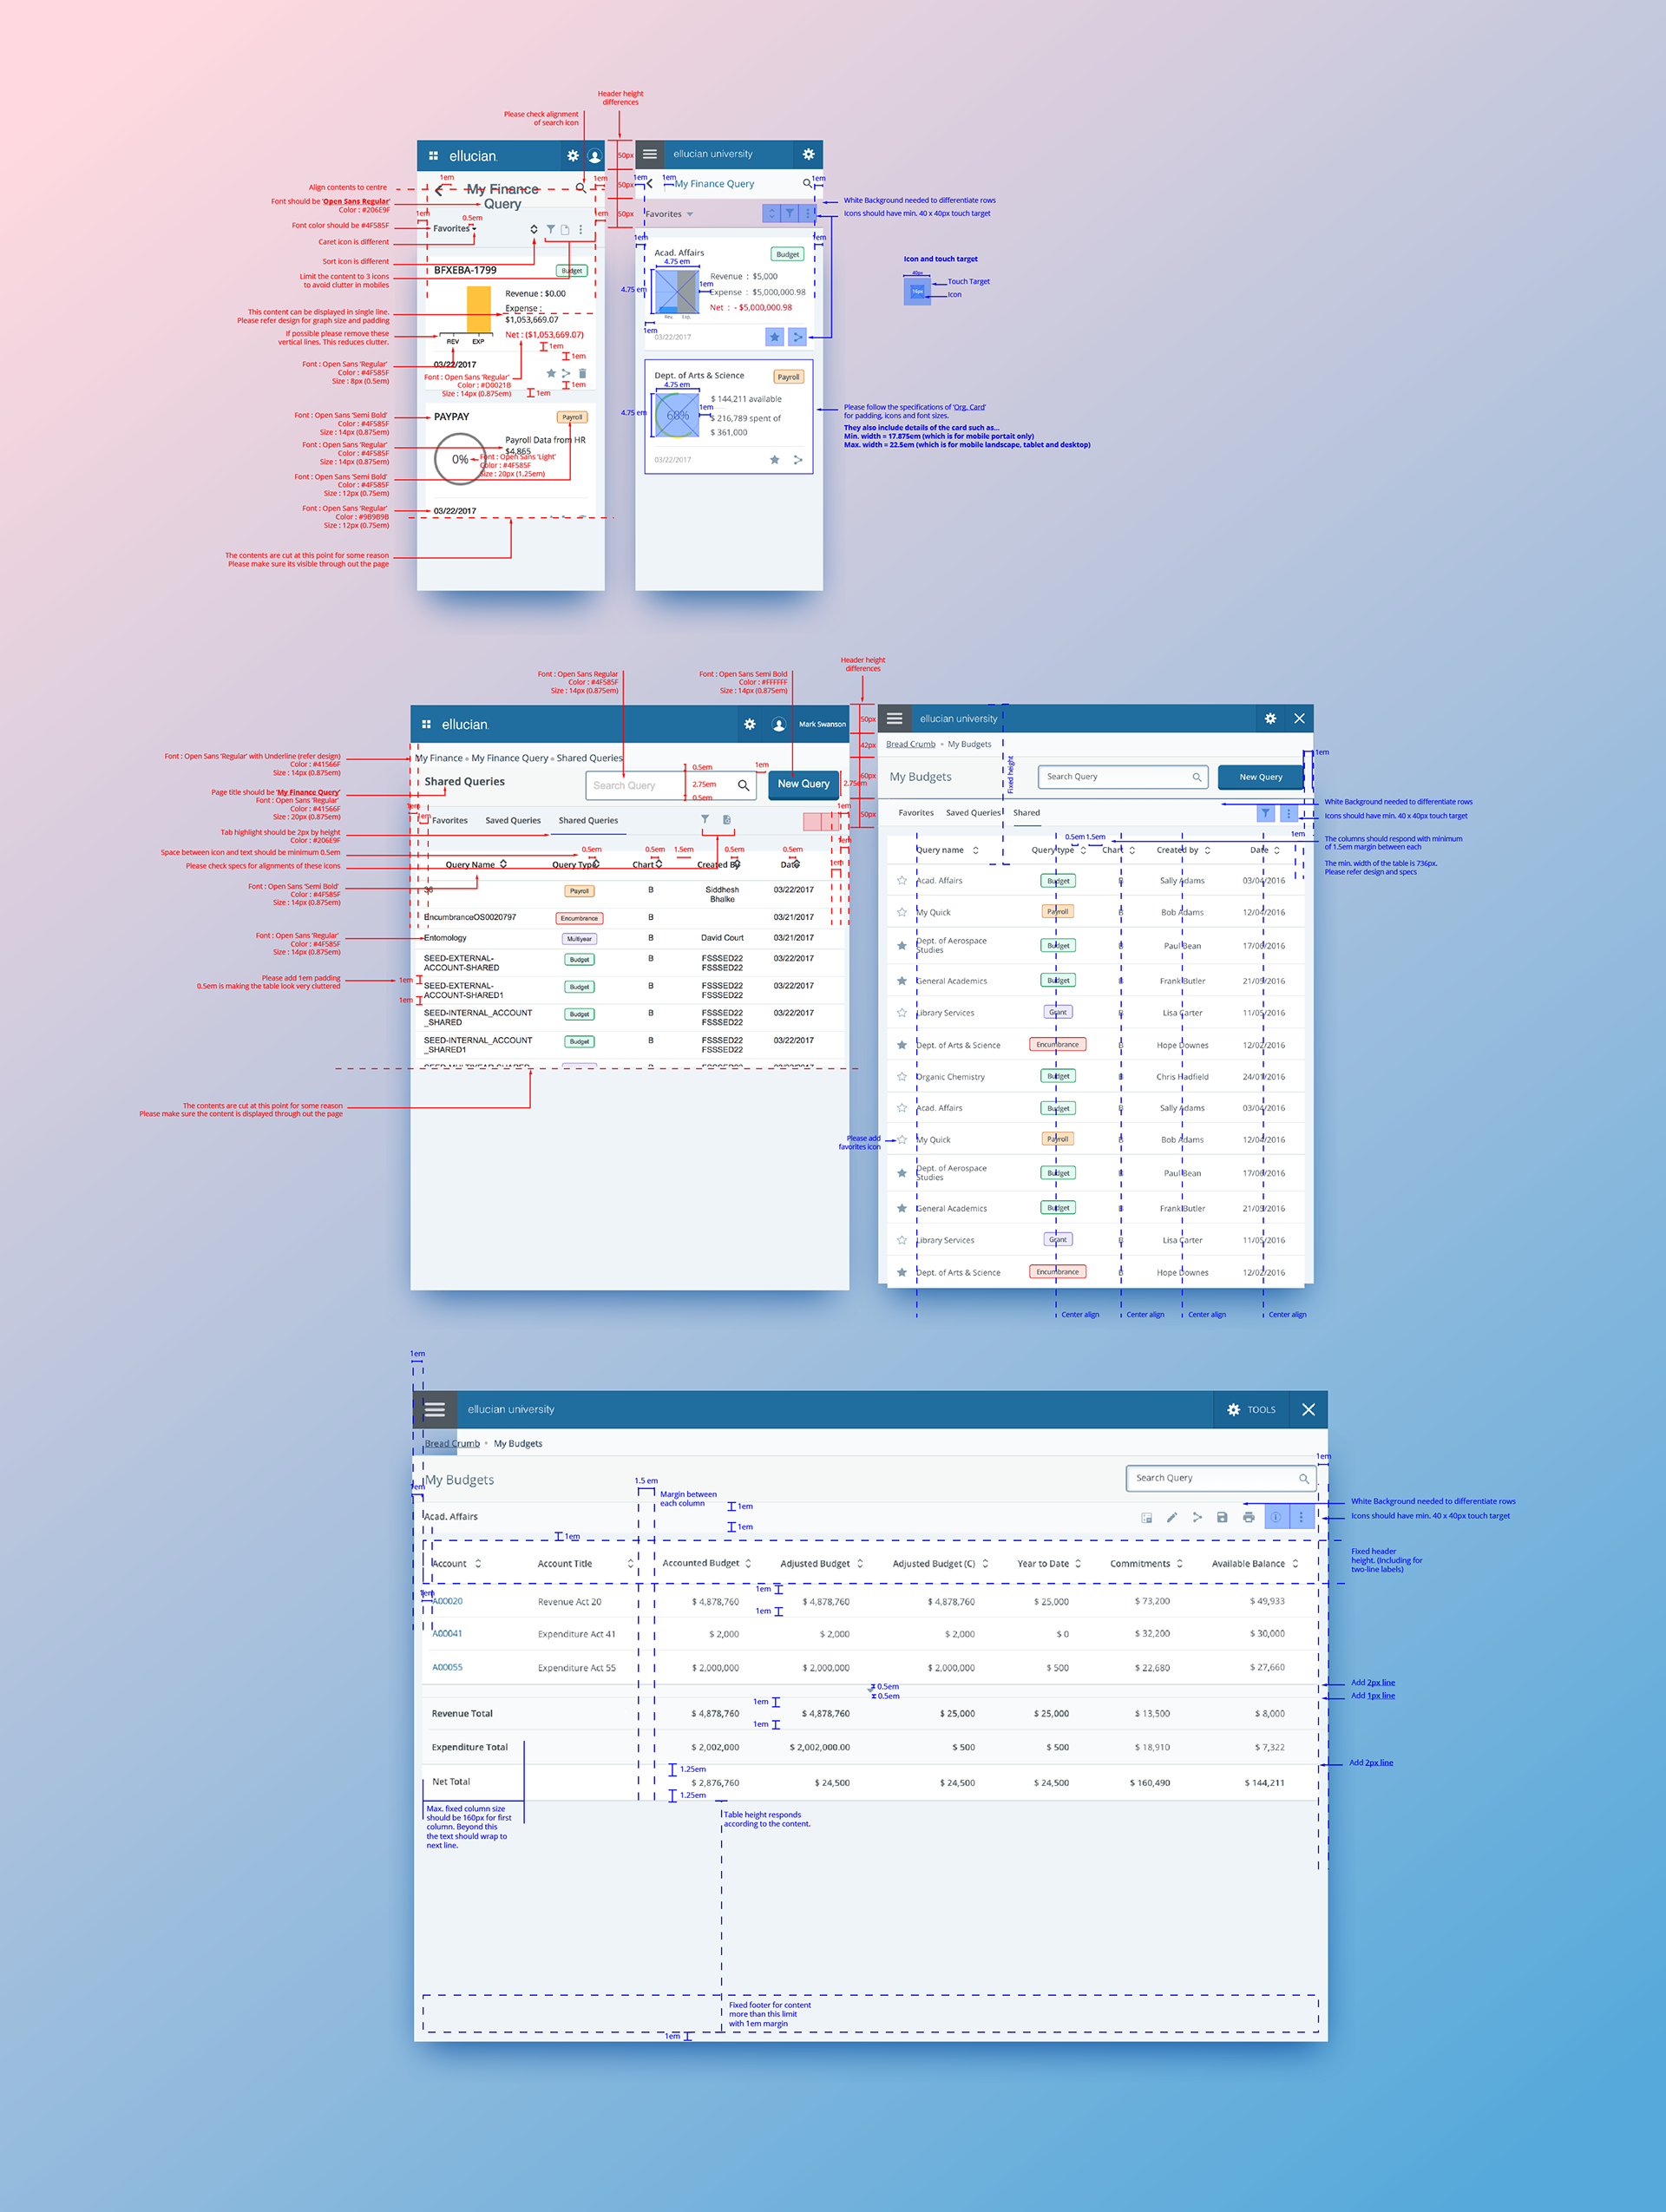
Spend analysis
Designed quick visual views of budget consumption through graphics and dashboard summaries.
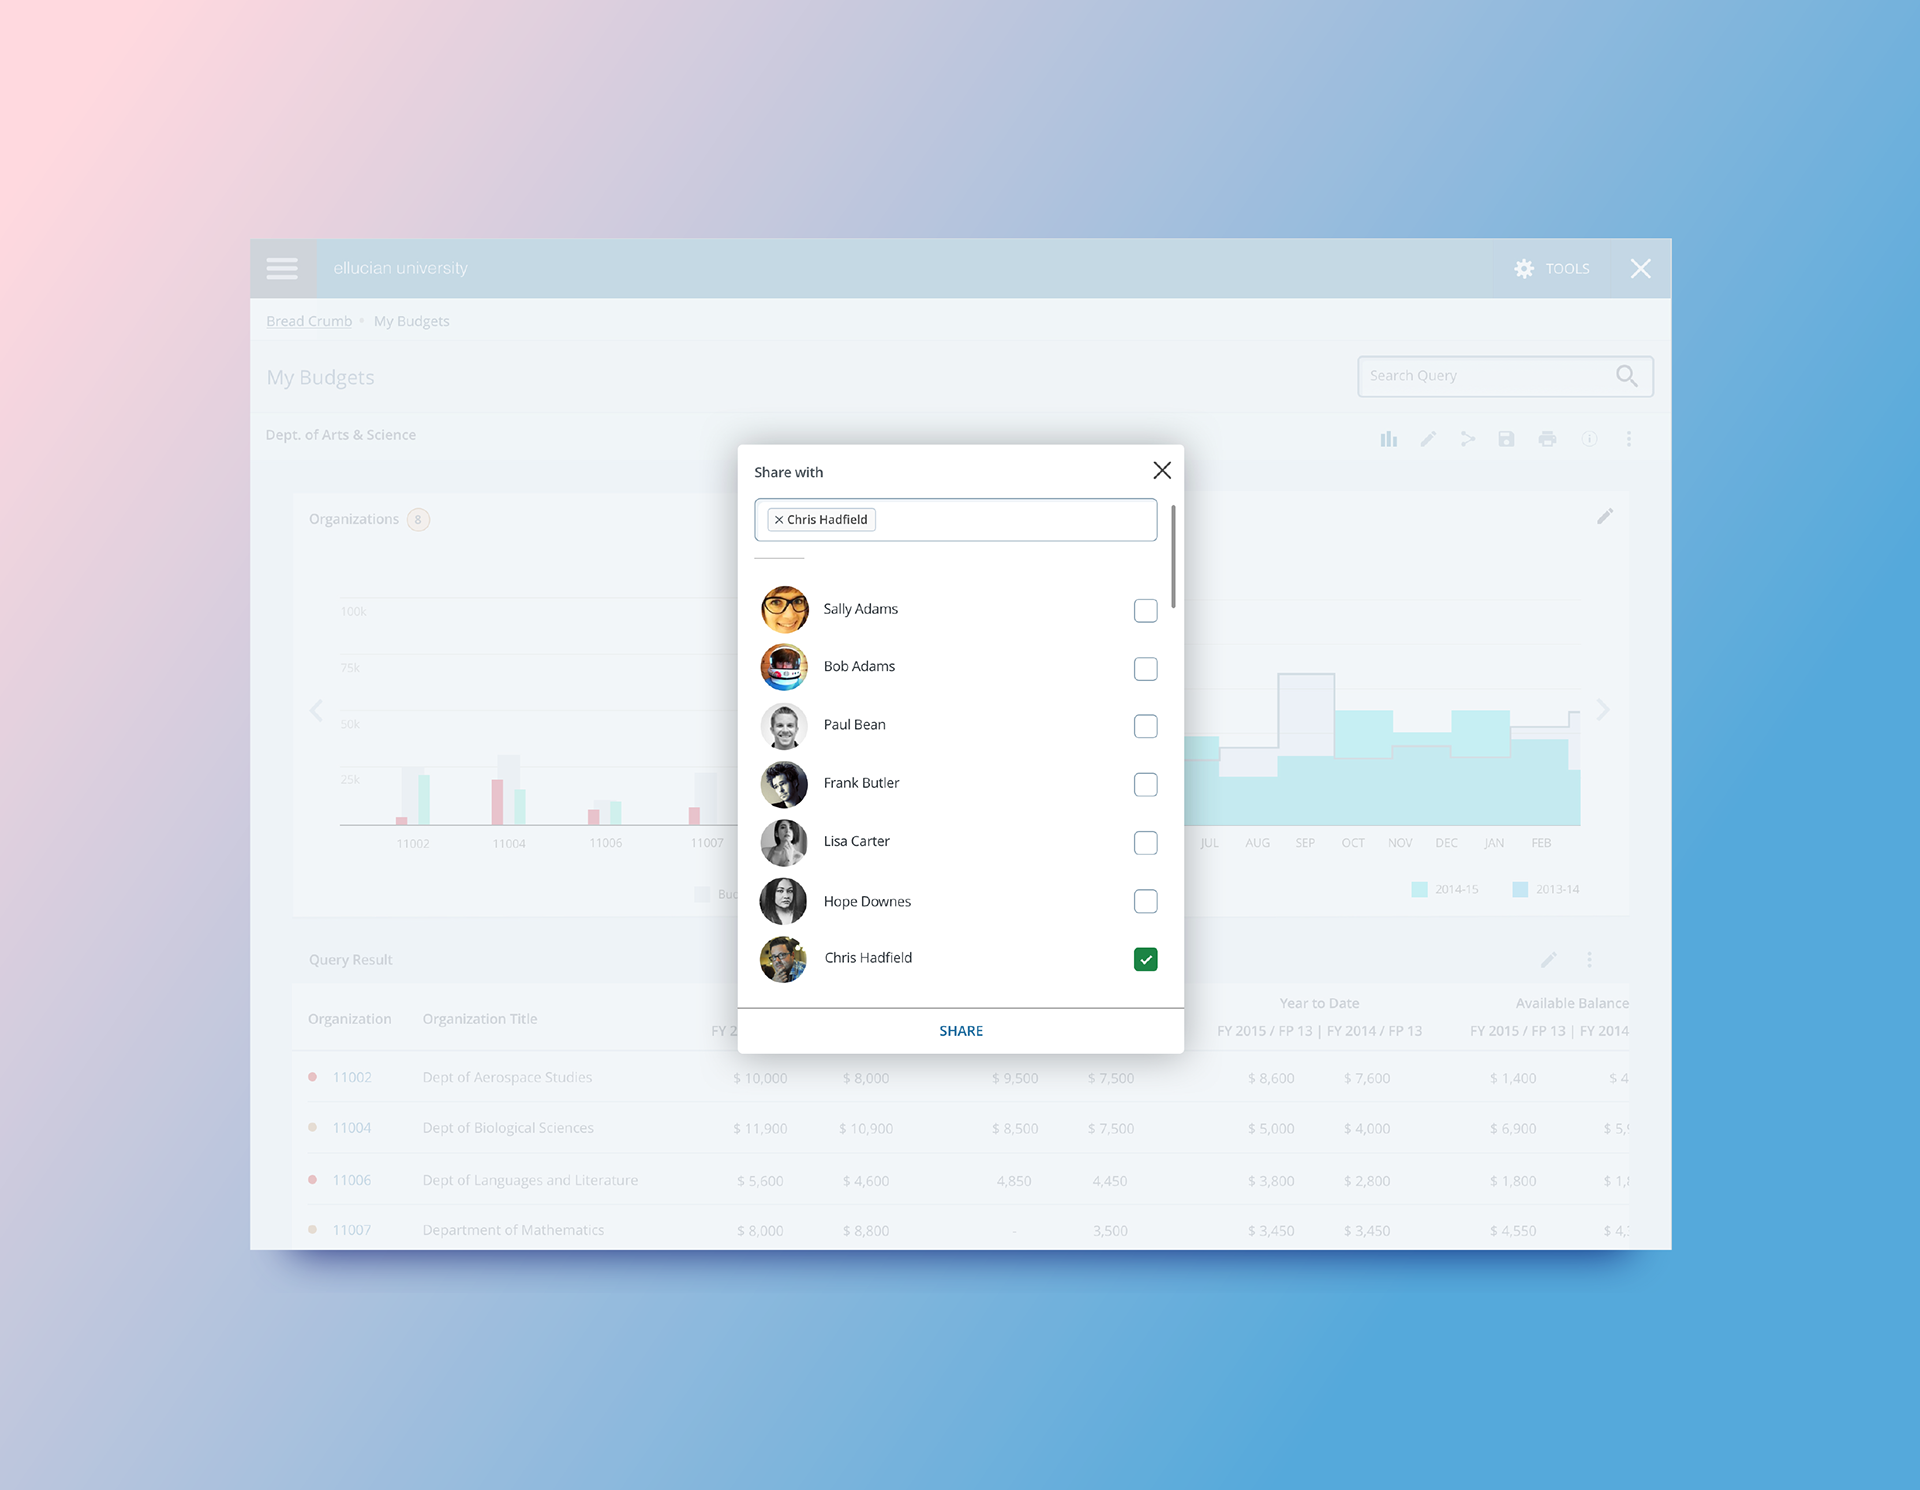
Drill-down navigation
Enabled movement from high-level summaries to document and attachment details.
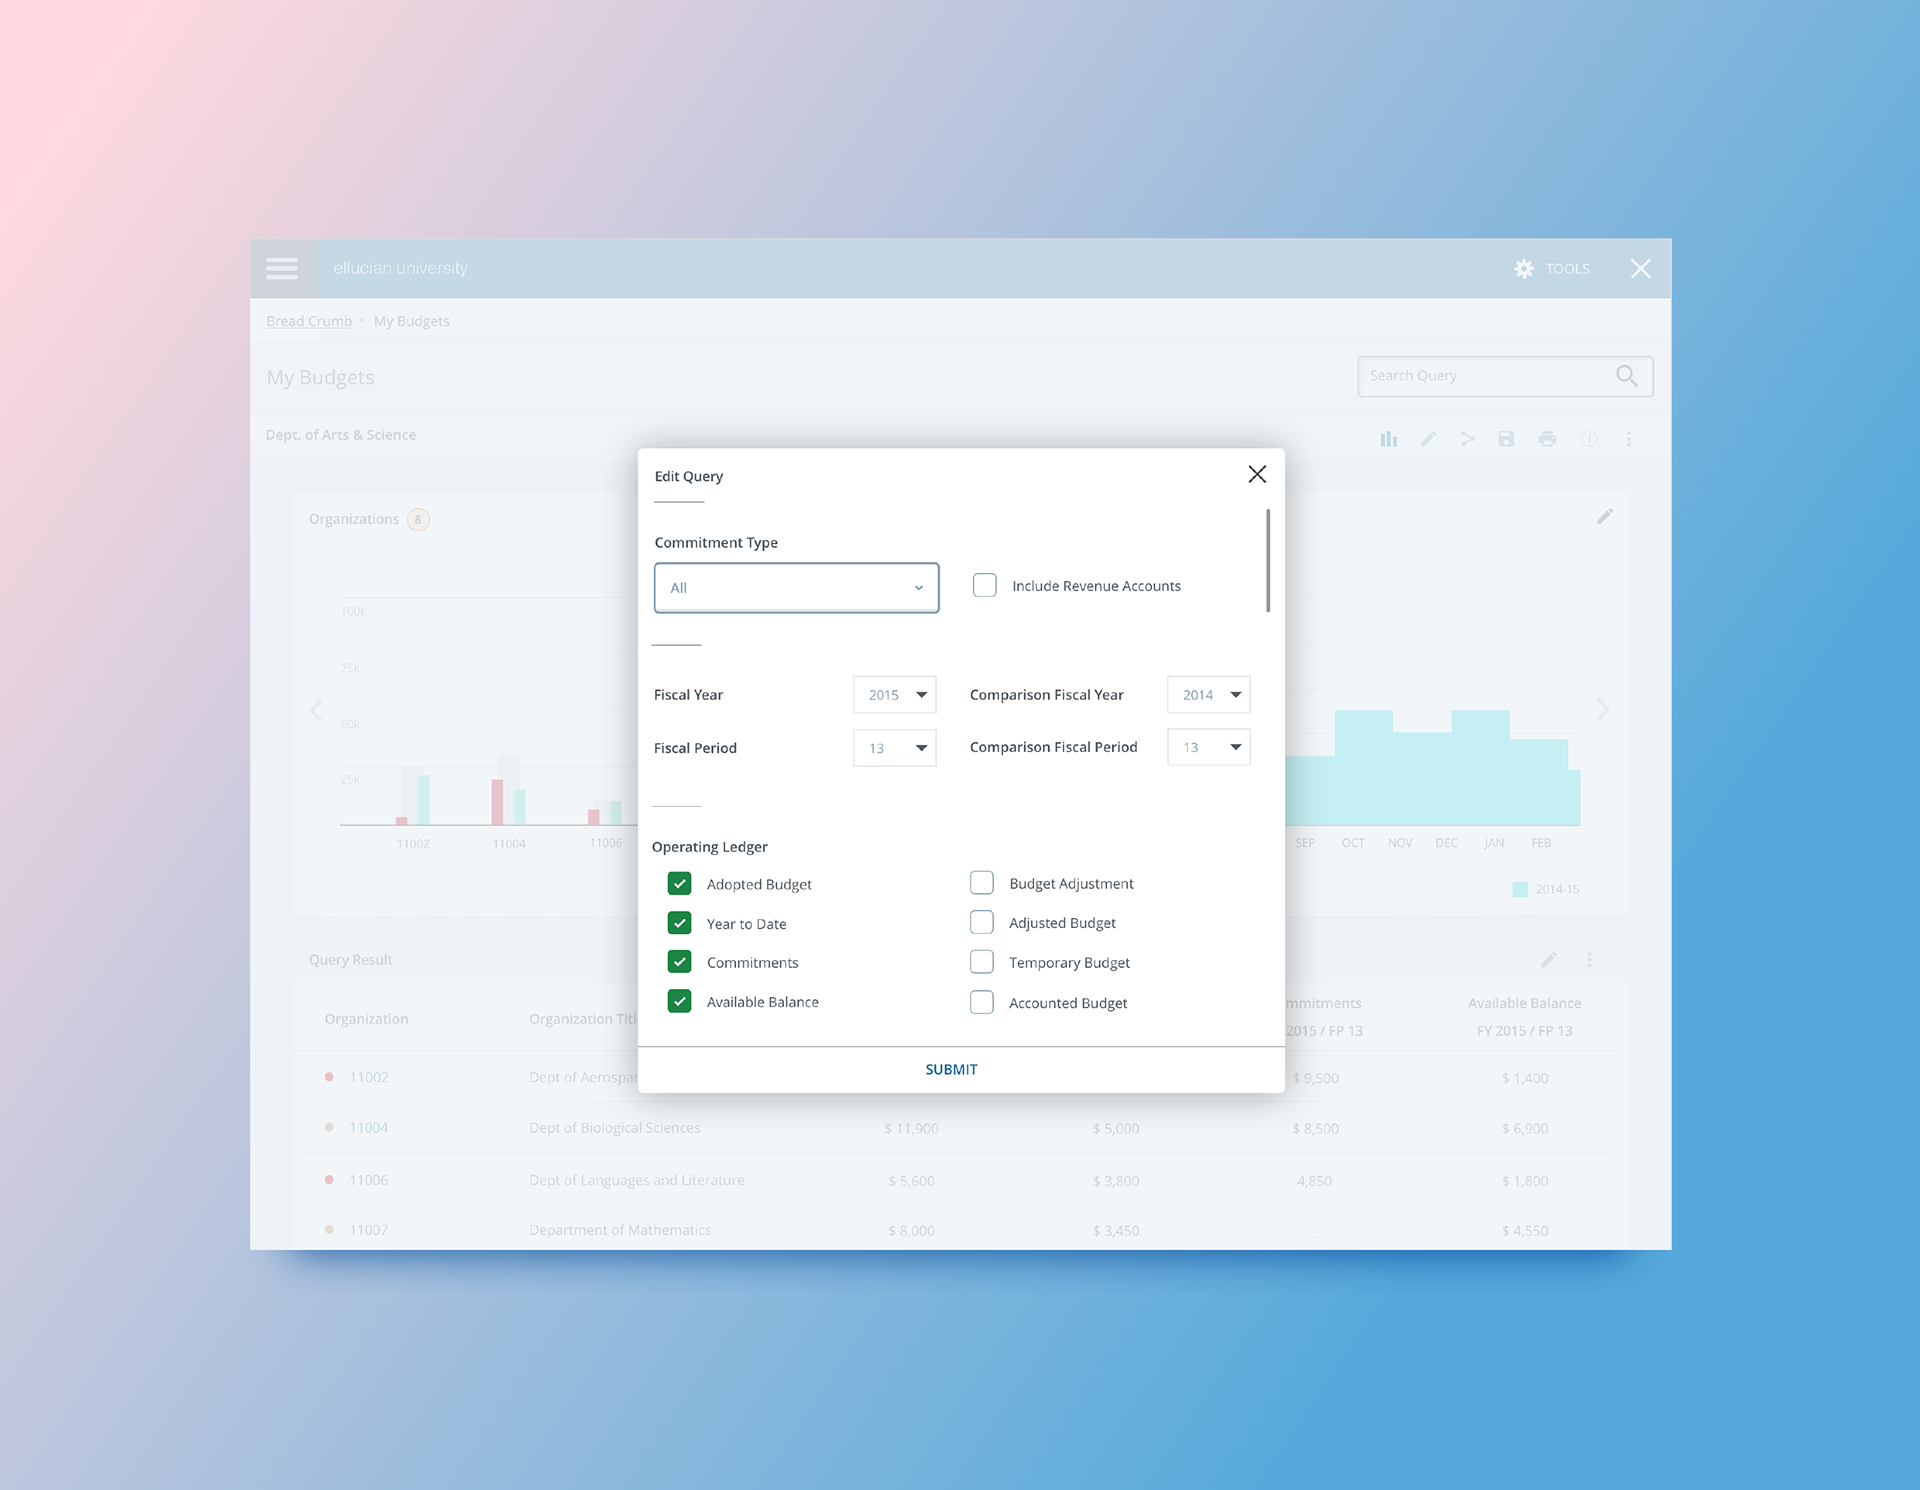
Configurable views
Supported comparison across user-defined time frames and preferred funding elements.
User feedback
"Having it all at your fingertips with graphing and comparisons is something very beneficial."
"It's very user friendly. I don't think it will be difficult for anybody to use it."
"It's visually appealing, very easy to read."
Outcome
My Finance Query became one of the most positively received modules in the Banner suite, with strong feedback on readability, visual appeal, and usefulness.